Quantcast
Channel: howmuch.net
Viewing all 687 articles
Browse latest View live

Visualizing Thirty Years of the U.S. Trade Deficit in One Graph. It is Still Huge Under President Trump

$
0
0

President Trump talks about the U.S. trade deficit all the time. He recently proposed new tariffs on steel and aluminum as one way to help lower the trade deficit that has contributed to shrinking American growth in these industries. With so much attention being paid to one economic number, now is a good time to understand how the trade deficit has changed over the decades.

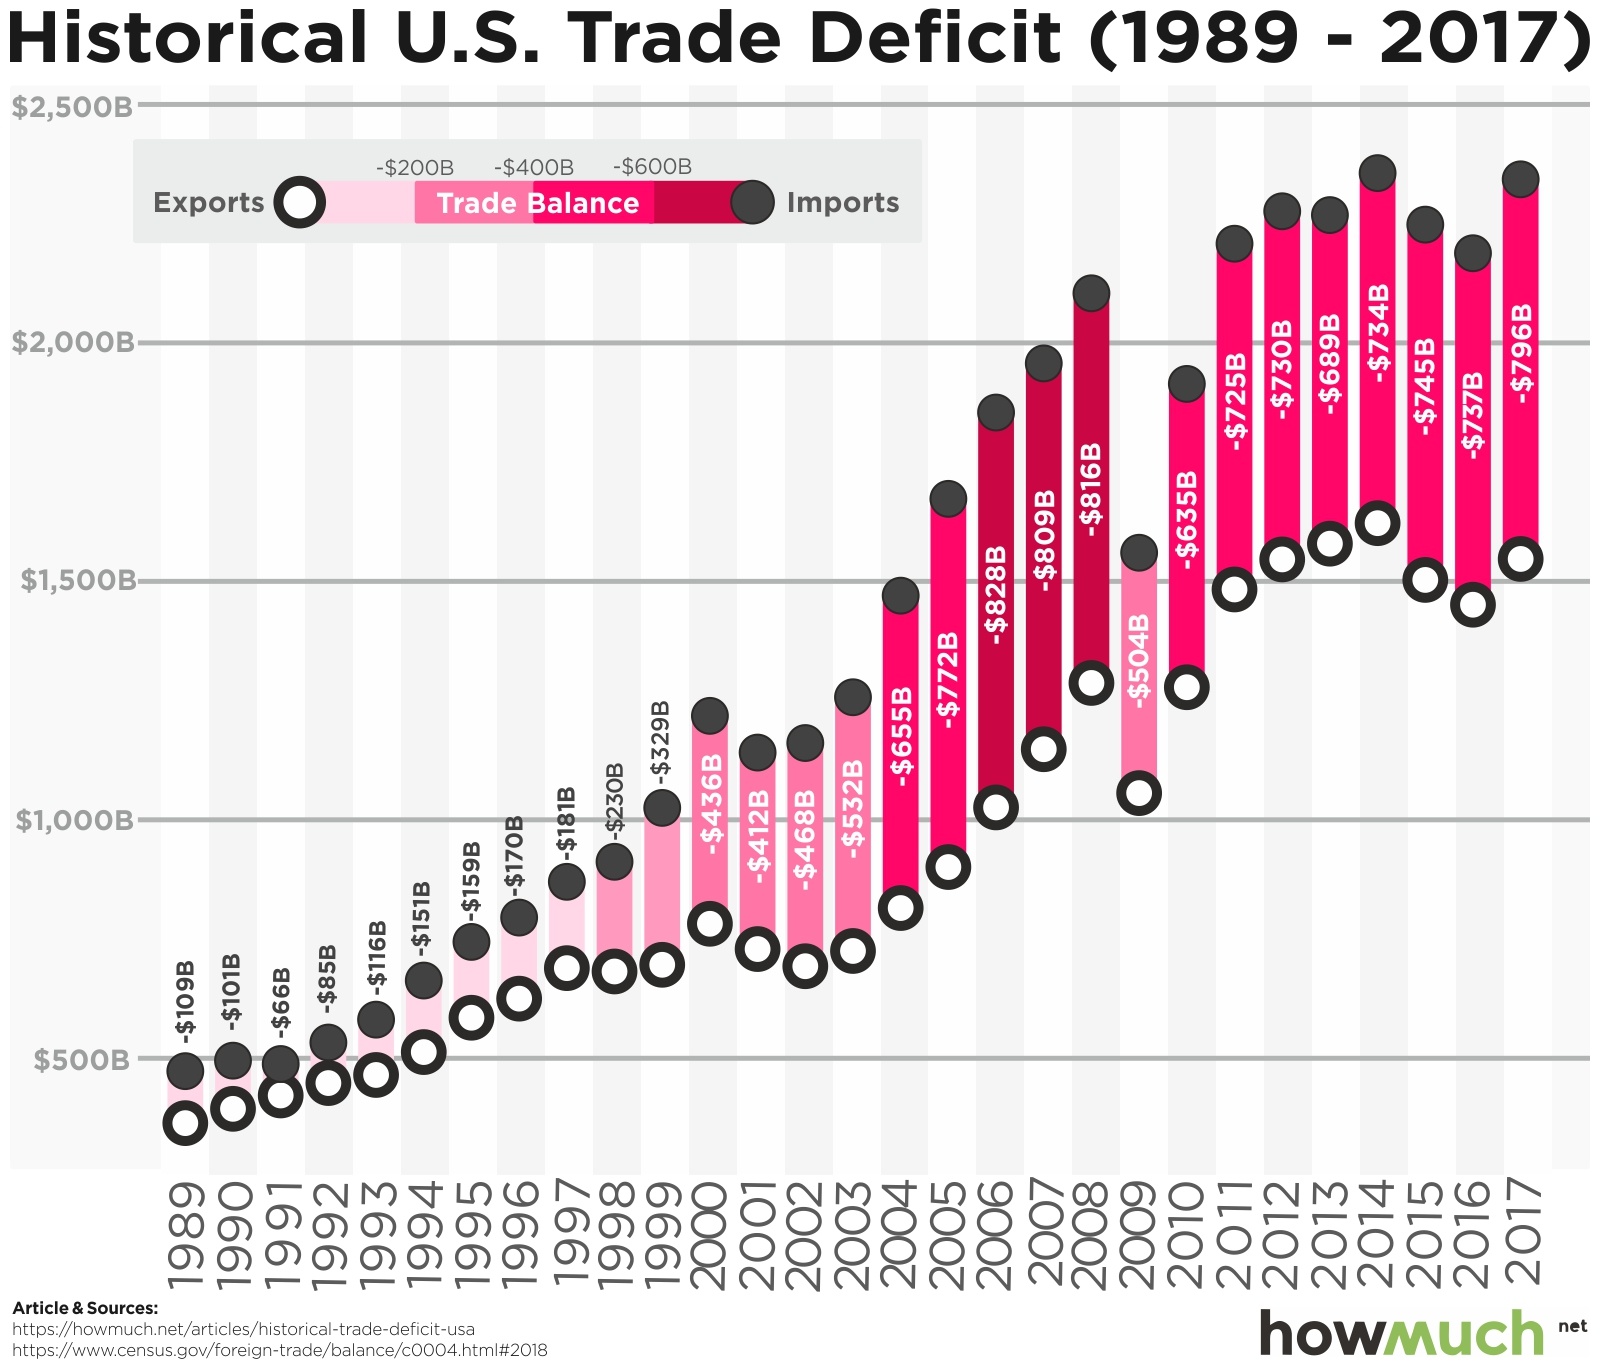
The data for our graph is based on figures from the U.S. Census Bureau. We visualized the deficit by plotting the total value of exports out of the U.S. as an open circle. Then, we placed the value of imports into the U.S. directly above it as a solid circle. The space between the two circles represents the trade deficit for each year, which we color-coded from light to dark red to show the severity of the deficit. All figures are calculated on a nominal basis, meaning that they aren’t adjusted for inflation. Visualizing imports, exports, and the deficit over the last 30 years reveals several key insights about the American economy.

First off, our trade deficit numbers only account for the difference between the value of physical goods being imported into and exported out of the United States. That means we’re counting things like cars, electronics, and food. Should we also include the value of services, like tourism, health care, or insurance? We’ll leave that for President Trump and the pundits to decide, but for simplicity’s sake we’re only focusing on physical imports and exports.

One thing is immediately clear: imports and exports are both on an upward trajectory year over year, but imports tend to grow faster. In other words, when looking at the graph you will notice the gap between the two numbers has gotten larger and larger while the space between the two circles has also become darker and darker. In short, the trade deficit used to be relatively small, averaging less than $150B year over year in the 1990s, but then it exploded in the 2000s. The single biggest increase occurred in 2004 when it jumped from $532B to $655B—a whopping $122B in one year.

There are a few obvious caveats to this pattern. The trade deficit reached its highest point in 2008 at $816B before collapsing in the wake of the Great Recession to $504B. This proves that closing the trade deficit isn’t necessarily an indication of a healthy economy. The gap then continued to grow again with the recovery, despite a speed bump in 2013 when it shrank to $689B from $730B the year prior. As a matter of fact, the trade deficit shrank the last year of Obama’s presidency before growing again under Trump.

Economists care about the trade deficit because it helps answer several important questions about the economy. For one thing, to what extent does a country rely on manufacturing, as opposed to consumption, for growth? Note that, interestingly, countries that export a lot more than they import don’t automatically have the best economies. For example, Thailand (+$44B), Russia (+$41.5B), and Nigeria (+$7.7B) all have trade surpluses, but there’s no chance any of them will overtake the U.S. in per capita income anytime soon. The $800B trade deficit is a problem, but clearly the macroeconomic health of the country is more complicated than a single number might lead you to believe.

Data: Table 1.1 


This Graph Shows Where the Filthy Rich Live in the World

$
0
0

It is hard to visualize how much $500M is in real life. Imagine giving away $100,000 to charity every week for the next 50 years and there would still be hundreds of millions left over. People with this kind of money are the captains of global capitalism. They can afford to live wherever they want and most undoubtedly own several different properties around the world. We created a new graph to better understand which countries are the most likely to be called home by holders of such unimaginable personal wealth.

The data comes from Knight Frank, a real estate and property consulting company. They publish an annual Wealth Report analyzing the property, location, and attitudes of the extremely wealthy. Knight Frank counted the number of individuals with over $500M in personal wealth who live in each country. Each piece of our modified pie chart corresponds to the number of ultra-wealthy people with their primary residence in each county. We color-coded each country by continent, creating an easy to understand snapshot of the distribution of the ultra-wealthy around the world.

The U.S. immediately stands out as the most popular with 1,830 individuals worth over $500M. That’s more than four times as many half-billionaires as the second-place country, China (490). A quick note on methodology: we separated Hong Kong (320 people) from China for counting purposes. Though Hong Kong has officially been part of China since 1997, the situation remains complicated. Even if we combine mainland China with Hong Kong (810 people combined), it still wouldn’t be even half of the U.S. number.  Germany takes third place in the rankings with 490 people, followed by Japan in fourth at 390. Special mention should be made of Switzerland:  this small, landlocked country in the middle of Europe is home to 250 half-billionaires. We suspect the country’s notoriously private banking laws are the main reason so many of the 0.001% call it home.

Our chart clearly demonstrates that the ultra-wealthy are concentrated on three continents: North America, Asia, and Europe. What is it about these places that make them so hospitable to multi-millionaires? There are a few possible explanations. Every country with 100 or more of these super-rich individuals is a democracy with the rule of law. The two exceptions are China (which just passed a law allowing its president to remain in power for life) and Russia (which just held an election widely seen as a sham by outside observers). Natural resources also allow countries like Saudi Arabia and the UAE to make the list, but the wealth just isn’t shared among nearly as many people.

Let’s take a step back. Here’s a list of the top 10 countries ranked in order of the number of people with more than $500M in personal wealth.

1. U.S. (North America): 1,830 people

2. China (mainland) (Asia): 490 people

3. Germany (Europe): 430 people

4. Japan (Asia): 390 people

5. Hong Kong (China) (Asia): 320 people

6. Canada (North America): 270 people

7. Switzerland (Europe): 250 people

8. France (Europe): 230 people

9. Russia (Russia): 220 people

10. U.K. (Europe): 220 people

Studying the high end of the wealth spectrum reveals a lot about the global economy. People with that kind of money have the resources and financial freedom to live anywhere in the world, but they have often chosen to make their homes in a few select countries. By this measure, the United States seems to remain far and away the best place to live for the ultra-wealthy.

Visualizing How Vulnerable is Each State to a Trade War

$
0
0

Is the U.S. about to engage in a trade war? Markets are down as political rhetoric continues to escalate around everything from tariffs to trade deficits. With so much attention being paid to international trade, we thought now would be a great time to figure out which states’ economies depend the most on imports and exports. We crunched the numbers and created a new graph.

We gathered our data from a few different places. The Bureau of Economic Analysis keeps track of GDP figures at the state level, the US Census Bureau tabulates trade figures for each state, and the American Enterprise Institute neatly synthesized the information. Last year we graphed data in an intuitive map of the U.S., but we decided to change things up this time around with a circular bar chart. Each blue bar represents the total GDP ($B) for each state. Because states vary significantly in size, we added a color-coded red bar to represent the percentage of the state’s economy dependent on trade. In other words, this metric tells you how important trade is to the overall economy of both large and small states.

Here are the top five states where international trade makes up the greatest percentage of the local economy (we included the GDP ($B) of each state for reference):

1. Michigan: $200B - 38.9%

2. Louisiana: $94B - 38.7%

3. Kentucky: $78B - 38.1%

4. Tennessee: $112B - 32.6%

5. South Carolina: $70B - 31.9%

And here are the five states (including Washington, DC) where international trade makes up the smallest percentage of GDP:

1. Washington, DC: $2B - 1.5%

2. Wyoming: $2B - 5%

3. South Dakota: $3B - 5.1%

4. Hawaii: $5B - 5.4%

5. New Mexico: $6B - 6%

We can quickly learn a lot about the American economy by looking at this kind of data. The average state generates about 20% of its economic activity through international trade of one kind or another. Six states get more than 30% of their GDP this way. Three states with huge economies are extremely reliant on trade:  California ($2,734B total GDP with 22.4% from trade), Texas ($1,692B total with 31.2% from trade), and New York ($1,550B total with 13% from trade). Pause for a moment and think about that. California alone depends on trade for more than $600B of their GDP every year. That’s bigger than the entire GDP of the 11 smallest states in the Union!

Given President Trump’s rhetoric around trade deficits and tariffs, we might expect him to perform better in states with a low dependence on foreign trade. Surprisingly, however, the exact opposite is true. He won seven of the top ten states most reliant on foreign trade, including each of the top five, and lost six of the ten states least dependent on foreign trade (including Washington, DC). Elections clearly aren’t won or lost based on economic interests alone.

We know several states that voted for President Trump directly benefit from high levels of international trade and pundits are learning to pay more attention to Trump’s actions as President than simply basing their analyses on what he says, on Twitter or otherwise. The recent carve-outs for American allies on his steel tariffs are only the latest case in point. We will have to wait and see if his recent trade war rhetoric follows a similar pattern.

Data: Table 1.1 

How Profitable Are the World’s Top Crypto Exchanges?

$
0
0

According to estimates, calculated by Bloomberg, the top ten cryptocurrency exchanges are bringing in as much as $3 million per day in profit. Considering that cryptocurrency did not even exist until 2009, profit at that level is absolutely astonishing compared to the historical development of other industries. It is easy enough to understand how cryptocurrency exchanges make their money--by charging fees for users who sell, buy, and withdraw cryptocurrencies. However, there are a few different important stats and trends that can help us to understand why certain exchanges are currently more profitable than others.

Where are the world’s top exchanges located?

Asian-based cryptocurrency exchange platforms are dominating the global crypto trading industry. Estimates put both Tokyo-based Binance and Hong Kong-based OKEx at over $1.7 billion traded daily. In terms of volume, these are followed by Huobi (Singapore), Bitfinex (Hong Kong), Upbit (South Korea), and Bithumb (South Korea). It is estimated that over 50% of the world’s daily crypto trading is done on Asia-based exchanges. However, a recently announced crackdown by the Securities and Futures Commission in Hong Kong could signal the beginning of a shift away from Asia if investors and exchange founders become more wary of the viability of exchanges headquartered there. Hong Kong isn’t the only place becoming less hospitable to crypto exchanges. Increased scrutiny in Japan, China, and elsewhere led Binance to recently announce that it will expand its operations to Malta, where the company will offer a fiat exchange option. This is a strategy which will not only help Binance comply with regulations, but could also increase the geographic scope of Binance’s user base.

Why are Asian exchanges so popular?

When most people around the world think of the biggest tech giants, a handful of names come to mind--Facebook, Google, and Amazon, for example. These are all all US-based companies. With the top cryptocurrency exchange platforms (by trading revenue per day), however, there is an obvious trend towards Asia as the dominant continent for exchange headquarters. Aelf co-founder Zhuling Chen cites several factors for the popularity of Asian-based exchanges.  A few of the most significant include:

Low costs of cryptocurrency mining:  energy costs have made many nations in Asia hubs for miners, fueling growth since the early days of crypto.

A well-established economy based on mobile payments:  WeChat, AliPay, and other mobile apps are used for both P2P (peer-to-peer) and C2B (consumer-to-business) payments on a daily basis.

Gaming Culture:  young people are familiar with using tokens in video games as rewards which hold value. Gaming has helped to instill the concept of tokenization and trading of tokens from an early age. For many, cryptocurrency can be seen as the next step in the evolution of tokens.


Will the current top ten exchanges remain profitable in the future?

While this answer has yet to be determined, there is undeniably more competition entering the crypto exchange platform market. For instance, Robinhood (US) hopes to become the top exchange platform by offering zero fees on crypto-to-crypto trading. Binance and the other top platforms have yet to lower fees to compete. Nonetheless, many exchanges are finding innovative ways to quickly adapt to the market’s changing landscape. Here are a few examples of what Binance and some other popular exchanges are doing to stay relevant.

Decentralization:  It is expected that most (if not all) cryptocurrency exchanges will soon become 100% decentralized. This is seen as a way to transfer monetary authority from exchanges to their users. It is also seen as a more secure option.

Fiat-to-crypto:  Binance, KuCoin, and many other exchanges do not currently offer fiat-to-crypto exchanges due to the time it takes to establish relationships with traditional banks. Now, however, many crypto-only exchanges are looking to spend the time required to build these relationships and overcome regulatory hurdles.

Incentivising investments:  On many exchange platforms, there are prize drawings for participants buying newly launched tokens. It’s very common for Binance to give away luxury cars, like it did during this Maserati + Mercedes-Benz Giveaway, or to award large sums of bonus tokens.


Will high volume trading continue?

While it’s certainly far too early to tell how much price volatility will affect crypto trading volumes and revenues for the top exchanges in 2018, the fundraising success of ICOs so far this year could serve as a positive indicator of the continued profitability. The combination of innovative user acquisition strategies and overall increases in the number of listed cryptos will likely help many of the top exchanges remain competitive and profitable.

Data: Table 1.1

How Much Income You Need to Afford the Average Home in Every State in 2018

$
0
0

The housing market has not only recovered its pre-recession levels, but some observers are actually starting to worry about yet another housing bubble. Housing prices are on the rise, thanks in large part to extremely tight inventory, so it’s worth asking:  are potential home buyers getting priced out of the market? The answer depends on where they live and how much money they make.

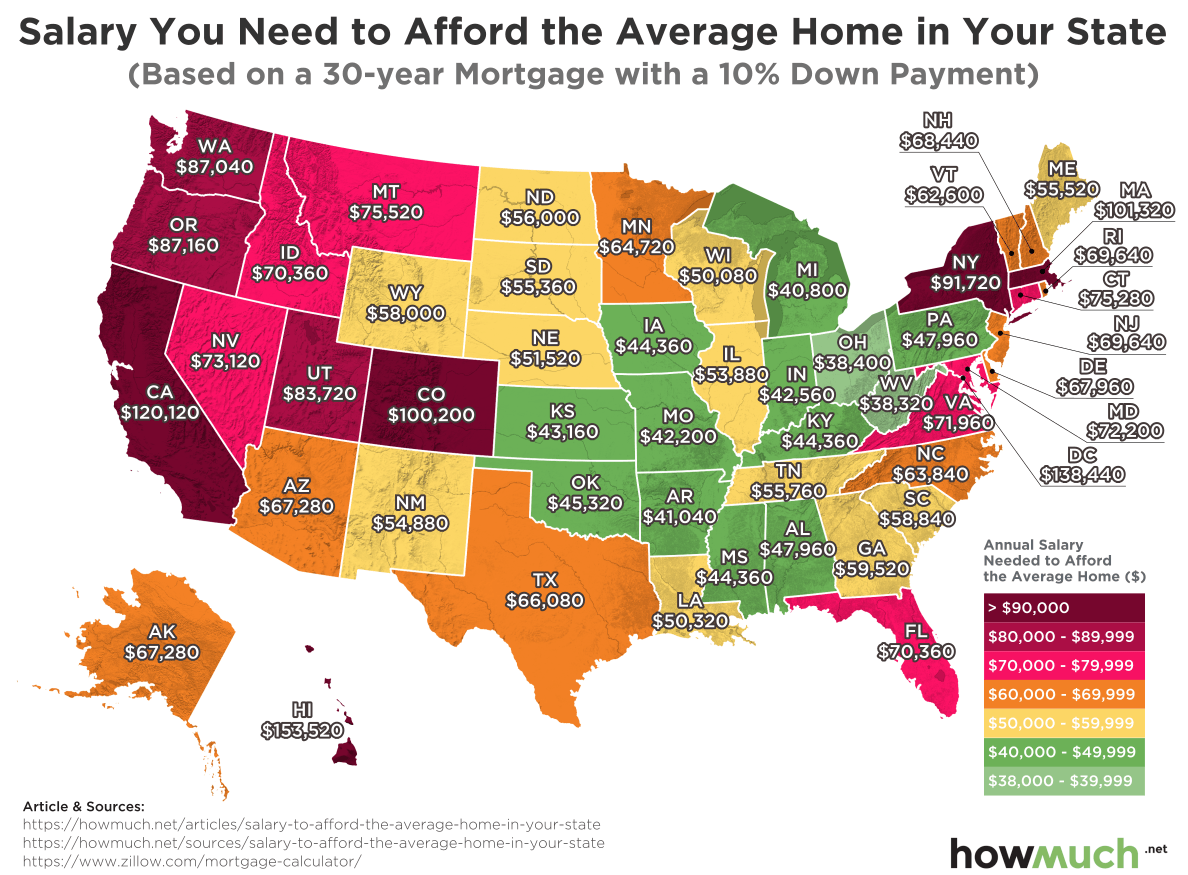
We collected average home prices for every state from Zillow which we then plugged into a mortgage calculator to figure out monthly payments. Remember, mortgage payments consist of both the principal and the interest for the loan. The interest rate we used varied from 4 to 5% in each state, depending on the market. The lower the interest rate, the lower the monthly payment. To keep things simple, we assumed buyers could contribute a 10% down payment. Another thing to keep in mind is that financial advisors commonly recommend the total cost of housing take up no more than 30% of gross income (the amount before taxes, retirement savings, etc.). Using this rule as our benchmark, we calculated the minimum salary required to afford the average home in each state.

Top Five Places Where You Need the Highest Salaries to Afford the Average Home

1. Hawaii: $153,520 for a house worth $610,000

2. Washington, DC: $138,440 for a house worth $549,000

3. California: $120,120 for a house worth $499,900

4. Massachusetts: $101,320 for a house worth $419,900

5. Colorado: $100,200 for a house worth $415,000

Top Five Places Where You Need the Lowest Salaries to Afford the Average Home

1. West Virginia: $38,320 for a house worth $149,500

2. Ohio: $38,400 for a house worth $149,900

3. Michigan: $40,800 for a house worth $160,000

4. Arkansas: $41,040 for a house worth $161,000

5. Missouri: $42,200 for a house worth $165,900

Our map creates a quick snapshot of housing affordability across the United States. There are several pockets in which only the upper middle class and above can afford to own even the average home, most notably across the West and in the Northeast. There are only two states west of the Mississippi River where a worker with an annual salary under $40,000 can afford a mid-level home:  Missouri and Oklahoma. Colorado stands out as the only landlocked state requiring a significant amount of income ($100,200), thanks in large part to the housing market around Denver.

Homes tend to be more affordable in the eastern half of the country, with a notable pocket of “green” (less expensive) states located in the upper Midwest. The North is generally more affordable than the South and the typical home is significantly easier to buy in places like Michigan or Ohio than in Louisiana or Arkansas.  Additionally, our map indicates that workers can more easily afford homes in the East than in the West, which is surprising given how much more land is available out West. It is important to note that there are certainly deep pockets of poverty in all of these places, which suggests that our map obscures the inequality behind averages.

The best takeaway from our map is that housing remains affordable in large swaths of the country, even though there will always be places like California and New York where there is simply too much demand for the available inventory. Thankfully, that doesn’t mean that buying a home is suddenly out of reach for average Americans in Ohio or Mississippi, for example.

Data: Table 1.1 

Mapping the Most Iconic Job in Every State

$
0
0

The U.S. economy is massive. Regardless of the recent stock market ups and downs, GDP grew 2.9% in the fourth quarter of 2017. The U.S. generates over $18.5 trillion in annual economic activity, well over 20% of that of the global economy. Americans enjoy such a large economy because they specialize and dominate in a wide range of industries. Similarly, individual states specialize in some industries more than others, as you can see in our latest map.

We gathered the data from the Bureau of Labor Statistics’ Occupational Employment Statistics survey, which 24/7 Wall St. compiled into a simple list of iconic jobs per state. Our analysis uses something called the location quotient to capture how common something is in a given location. For example, petroleum engineers are relatively hard to find across the county, but you can find more than 50% of them in Texas. We mapped these so-called “iconic” jobs by color-coding their popularity in each state and we added the average salary as a reference.

Top Five States with the Highest-Paying Iconic Jobs

1. New Mexico: Physicists ($143,330)

2. Texas: Petroleum engineers ($139,800)

3. Maryland: Health diagnosing and treating practitioners ($130,690)

4. Virginia: Legal support workers ($104,760)

5. Connecticut: Actuaries ($101,580)

Top Five States with the Worst-Paying Iconic Jobs

1. Missouri: Locker room, coatroom, and dressing room attendants ($18,850)

2. New Jersey: Shampooers ($19,440)

3. California: Farmworkers and laborers, crop ($21,960)

4. South Dakota: Forest and conservation workers ($23,820)

5. North Carolina: Textile machine operators ($24,670)

This data paints an interesting picture of the U.S. economy. Given the right conditions, workers with an iconic job in their home states can be extremely well compensated. This is especially true for jobs requiring advanced degrees and special certifications. Texas stands out in the list of top five. More than 50% of the country’s petroleum engineers live there, raking in on average $140k each year. Another high-paying industry, commercial and industrial designers are concentrated in Michigan, where they make $81k. Fashion designers in New York also do well for themselves with $71k in annual compensation. These pockets for specialized skills can attract talent from around the country. If you want to drill oil, move to Texas.

Unfortunately, the sad news is that most workers with iconic jobs are not very well-compensated, probably because their jobs do not require any post-secondary education. Locker room attendants in Missouri and shampooers in New Jersey probably didn’t go to college. Another factor in holding down wages in some of these industries is the supply of labor. More than 50% of all the farmworkers in the country live in California. Since bosses can easily replace these workers, they only make $22k. Just because your job is “iconic” and often associated with your state due to its significance there, does not mean it will pay you well.

Our map also validates some of the preconceived notions Americans have about different parts of the country. Iowa needs a lot of soil and plant scientists because the state’s economy relies so much on agricultural production. Want to captain a ship for a living? Go to Louisiana. Trying to sell mining equipment? Open a location in Alaska. Western states like Idaho, Montana and South Dakota all have a lot of forest and conservation technicians. No surprise that Nevada houses the majority of workers in the gambling industry. Even Hawaii’s iconic job fits a common stereotype:  dancers, with no median salary given by 24/7 Wall St., are the most iconic employees.

Data: Table 1.1

The Cheapest and Most Expensive U.S. Cities to Start a New Company

$
0
0

Founding a new company carries all sorts of risks, not the least of which is the cost associated with leasing an office and hiring employees. But where is the best city to start a new company, and what are the most important factors to consider? We created two new graphs on the ten most expensive and ten cheapest cities in the U.S. for a new company to call home.

We gathered the data from SmartAsset, a personal financial advice website. SmartAsset studied 80 cities and calculated the average costs for starting a new company, including filing fees, office space, utilities, legal and accounting fees, and, most importantly, payroll. To make a fair comparison between cities, SmartAsset assumed a company would need a 1,000-square foot office space and have five full-time employees. We calculated each of these metrics as a percentage of the overall startup cost and turned them into slices on a pie chart. This lets you quickly and easily understand the costs associated with creating a new company in different locations across the U.S.

The first surprise from our graph has to do with payroll. As one might expect, hiring people to run the company is by far the biggest expense. It accounts for over 80% of the total price tag in every city. However, the more affordable cities devote a higher percentage of their budgets to making payroll, topping out at 91.4% in Wichita, KS. Compare that to New York, where only 80.1% of the budget goes toward paying employees. Of course, it is much more expensive in absolute terms to hire people in New York ($316K) than it is in Wichita ($216K).

Less surprisingly, the most significant difference between these places is the cost of office space. New companies only need to pay $15,200 in the cheapest place in our analysis, Chattanooga, TN, which would only be only 6.6% of a startup’s total budget. Compare that to New York, where a comparable office would cost an incredible $69,310, or 17.5%, of their budget. That’s more than 4 times as expensive and could be the sole reason holding the company back from hiring another employee or growing in other ways.

Part of the reason why it costs so much more to start a new company in cities like San Jose or San Francisco is that these places are famous for startups. Entrepreneurs flock to coastal cities instead of the Midwest, creating substantial competition for talent and high rents for prime real estate. Proximity to venture capital is also a serious concern in the startup world.

Despite these inherent benefits of starting a company in one of the more established locations, the good news is that many cities away from the coasts are trying to replicate the experience of Silicon Valley. If you’re seeking a home for your startup, maybe consider one of them instead of the old standbys, and save yourself some of that venture capital cash for other aspects of your business.

Data: Table 1.1

These are the Hottest Jobs in U.S. in 2018: Lots of Openings and Dream Salaries

$
0
0

Technology stocks are taking a beating right now, especially the biggest companies in the market, but, despite the current news cycle, economists predict that the technology sector will continue to produce substantial growth over the long haul. Most importantly, this segment of the economy will continue to provide solid, high paying jobs. Our new graph indicates what sectors lead the list of best jobs.

We gathered the data from Indeed, which analyzed two factors to determine what counts as a good job. First, the base salary must be at least $75,000, well above the national average of around $47,000. Second, the jobs must be in a high-growth sector with lots of opportunities to enter the field (e.g., astronauts and professional sports players aren’t eligible). Indeed analyzed their own numbers to see how those high-paying positions had expanded on their own site since 2014. We used this information to create a hierarchy by salary range: the highest earners are on top and the lowest are on the bottom. We then color-coded each figure to represent the historical rate of growth over the past three years. We also correlated the size of the figure with the base salary, creating an easy to understand graph of the best jobs in the U.S. today.

Here are the top ten “best” jobs ranked in order of base salary, together with the position’s historical job growth:

1. Machine learning engineer: $136,241 with 166% growth

2. Data scientist: $132,915 with 106% growth

3. Optometrist: $131,692 with 118% growth

4. Computer vision engineer: $131,297 with 169% growth

5. Development operations engineer: $125,714 with 91% growth

6. Agile coach: $120,142 with 80% growth

7. Chief estimator: $116,848 with 101% growth

8. Full stack developer: $111,640 with 198% growth

9. Head of sales: $108,788 with 42% growth

10. Staff pharmacist: $107,584 with 42% growth

From a visual perspective, one thing immediately stands out on our graph. The top half of the pyramid contains the most purple figures when compared to the bottom, which is mostly green. In other words, most of the highest-paying jobs have also been the fastest growing. This makes a certain amount of sense since employers seeking highly skilled workers are forced to pay a premium for their labor, especially if the number of openings exceed the numbers of qualified applicants. In other words, workers in those industries and positions clearly have the upper hand.

It is also worth noting how many of the highest-paying jobs are in the technology sector. Machine learning engineers ($136,241), data scientists ($132,915), computer vision engineers ($131,297), and full stack developers ($111,640) all work on cutting edge technology. When you see a field with 6-figure average salaries and almost 200% job growth, that’s a clear indication of a technical skills gap. Compare that with the bottom of the pyramid, which is largely comprised of occupations from a variety of industries, including pharmacists, construction managers, and architects. These aren’t bad jobs, but they don’t require the same kind of rigorous high-tech education as many of the high pay/rapid growth jobs in the tech sector.

The big takeaway from our analysis is that if you want a high paying job with lots of professional growth opportunities, you should definitely consider getting a degree in computer science with a specialty in engineering or data science. These positions are primed for substantial expansion in both wages and opportunity in the years ahead.

Data: Table 1.1


See which Americans Have the Highest Tax Bills in the Country

$
0
0

They say only two things in life are absolutely certain: death and taxes. With Tax Day just around the corner, many Americans are gathering paperwork and getting ready to file their 2017 taxes. Federal and state income taxes represent just part of an individual’s total tax burden, however. Our new visualization illustrates how the state you live in determines the relative tax burden between federal, state, gas, sales, and property taxes.

We compiled the data from GoBankingRates, which analyzed a few different sources to figure out the average tax burdens for each state. These included the 2016 Census Bureau American Community Survey for median household income levels, Zillow’s median home value and property tax information, the American Petroleum Institute’s average gas consumption figures, the Tax Foundation’s numbers of state sales tax rates, and Gallup’s estimates for average daily spending. We sliced and diced all this data to represent each state as a pie chart where each piece corresponds to the weight of each category of taxation. We then sized each pie chart based on the total taxes paid.

Top Five States with the Lowest Total Tax Burdens

1. West Virginia: $6,837

2. Montana: $7,035

3. Mississippi: $7,086

4. Kentucky: $7,537

5. Arkansas: $7,858

Top Five States with the Highest Total Tax Burdens

1. New Jersey: $22,829

2. Connecticut: $20,714

3. Massachusetts: $20,115

4. Washington, DC: $20,033

5. Maryland: $19,615

We can learn a lot about the economy and the American political system by analyzing our visualization. First off, the Northeast has several states with tax burdens far higher than those in the rest of the country. People in New Jersey pay more than 3 times as much in total taxes as their counterparts in West Virginia. There are a few different explanations for these enormous differences in tax levels, the most obvious being that some states don’t collect any income tax (like Tennessee and Florida) and a few don’t collect any sales tax (like Montana).

Despite these differences, every state taxes property and this is where the true disparities are found. New Jerseyans fork over an average $7,163 in property taxes each year, representing an incredible 31% of their total tax burden. Compare that to West Virginians, who pay only $544, or 6%, of their total tax burden in property taxes. That means property taxes are 5 times more expensive in relative terms—or 13 times more expensive in absolute terms—in New Jersey than West Virginia!

Another interesting trend in our visualization is how clearly it reflects the partisan nature of different states’ decisions about taxes. President Trump won none of the 15 states with the highest tax burdens, and Hillary Clinton won only one of the 15 with the lowest (New Mexico). Many of the states typically considered political “swing states” come election time are in the middle of the pack; for example, Wisconsin (21st), Iowa (24th), Pennsylvania (26th), Michigan (30th), and Ohio (35th). How Trump’s recent tax cut bill (or even a second one) will affect the political landscape is anyone’s guess, but our graph makes us wonder if political divisions determine tax rates or if tax rates determine political divisions.

So why doesn’t everyone move to low-tax states? To a certain extent, rich people are actually leaving states with high tax burdens for places with friendlier policies. Most people can’t afford to relocate their entire families even if it would mean hundreds of dollars in tax savings, but at the very high end the numbers can really add up and may make a big move worth the cost.

Data: Table 1.1

You Need to Get Paid This Much to be in the Top Half of Earners

$
0
0

What does it mean to be rich? An oft-cited study from a few years ago suggests that money does in fact buy happiness—to a point. Earning an annual income of $75,000 is directly correlated to personal fulfillment, but earners above that threshold reported less happiness than we might expect. So which cities have average salaries at the magic number of $75k per year? Check out our new visualization.

We gathered average household income figures from the U.S. Census Bureau for the top 50 most populated metro areas for 2016, the latest year for which numbers were available. We then plotted each city as a slice on an exploding pie chart. This lets you quickly and easily see how much money your household would need to make to be in the top 50% of earners in your area.

1.     San Jose-Sunnyvale-Santa Clara, CA: $110,040

2.     San Francisco-Oakland-Hayward, CA: $96,677

3.     Washington-Arlington-Alexandria, DC-VA-MD-WV: $95,843

4.     Boston-Cambridge-Newton, MA-NH: $82,380

5.     Seattle-Tacoma-Bellevue, WA: $78,612

6.     Baltimore-Columbia-Towson, MD: $76,788

7.     Minneapolis-St. Paul-Bloomington, MN-WI: $73,231

8.     Hartford-West Hartford-East Hartford, CT: $72,559

9.     Denver-Aurora-Lakewood, CO: $71,926

10.    New York-Newark-Jersey City, NY-NJ-PA: $71,897

Only one metro area crosses the $100k mark for average household income (San Jose, CA), and only two surpass $90k (San Francisco and Washington DC). The top two are clearly at an advantage thanks to Silicon Valley—computer engineers no doubt add to the average income figure. Washington DC makes the top three because of its proximity to American political power. Lobbyists and government contractors have to get paid after all.

The bad news is that only six cities surpass the threshold of $75k for maximizing personal happiness. Every other metro area falls somewhere below—sometimes not even half as much—as their more prosperous counterparts. New Orleans, LA is way down at the very bottom, where the average household only brings in $48.8k. In fact, 37 of the top 50 metro areas have average income levels below $70k. Of course, there are certainly people who make six figures living in every city in the country. But our graph shows that, all things being equal, the odds of making at least $75k will remain out of reach for the clear majority of Americans.

But it all depends on where you live. Making six figures means a family is in the middle class in Silicon Valley, but for most of the country, that much money would be a dream come true. Check out our cost of living calculator to gain a deeper understanding for exactly how far an average salary goes in your city.

Data: Table 1.1

Mapping the Richest People of All Time from Every State

$
0
0

The U.S. is home to more billionaires than any other country in the world, but you might be surprised to learn that there are 7 states that haven’t produced a single billionaire. In fact, ranking the richest people of all time from every state reveals extremely wide differences in wealth.

How do you figure out the net worth of the richest individual of all time? We found our data thanks to Forbes, which did much of the number crunching for us. A lot of the richest people ever have long since died, meaning we had to adjust numbers for inflation to fairly compare it to today. We then color-coded each state to represent the range of its most successful citizen, and we added a picture of the millionaire or billionaire in question.

Top 10 States with the Wealthiest People of all Time

1. New York: John D. Rockefeller, $257.25B

2. Oklahoma: Sam Walton, $171.55B

3. New Mexico: Jeff Bezos, $116.57B

4. Pennsylvania: Richard Mellon Scaife, $104.73B

5. Washington: Bill Gates, $90.54B

6. Nebraska: Warren Buffett, $90.44B

7. Massachusetts: Marshall Field, $76.26B

8. Michigan: Henry Ford, $68.33B

9. Illinois: Larry Ellison, $56.76B

10. Maryland: Sergey Brin, $53.32B

Our map reveals several interesting trends about the richest person from every state. First off, almost every person on the map is a man, although there are a few exceptions. Anita Zucker is the wealthiest of the 3 women with a personal fortune of $3.83B. At the very upper end of the spectrum, only four people cross the $100B mark, with nobody coming anywhere close to John D. Rockefeller at the very top ($257.25B). That’s the kind of money that lets you establish permanent multi-generational foundations long into the future.

Another interesting fact about our map is the relationship between where someone was born and where they made their money. In other words, clearly sometimes people have to move to make a fortune. Jeff Bezos is originally from New Mexico, but Amazon is headquartered is in Seattle, Washington. Sam Walton may have been born in Oklahoma, but his company (Walmart) is headquartered in Arkansas. Other names are synonymous with their birth states. Bill Gates founded Microsoft in Washington, and John Menard Jr created the eponymous hardware store in Wisconsin. Henry Ford came from Michigan, the same state he built the famous car company. Warren Buffett is the Oracle of Omaha, and guess what? He still lives in Nebraska.

It is hard to grasp just how enormous these personal fortunes really are. As a whole, the group averages about $30B in net worth. If you combine all their fortunes together, you would have more than $1.5 trillion. That’s about the same size as Canada’s entire economy. So where are the best odds of making this list? You might be in luck if you come from New Hampshire. Brooke Astor only made $150 million.

The Gun Industry’s Economic Impact in One Map

$
0
0

Which region is more dependent on the gun industry for jobs, deeply conservative and rural Western states or the liberal and urban Northeast? You might be surprised to find out that the most gun-friendly states are often not the ones where the guns are actually produced. Our new map breaks down which states have the most economic dependence on the firearms industry.

We gathered data from the Firearms and Ammunition Industry Economic Impact Report from 2017 from the National Shooting Sports Foundation, an organization representing over 12,000 companies in the gun industry. The report tabulates the total jobs and average wages for workers who manufacture and sell guns in each state. We visualized these numbers on a map where the size of the state corresponds to the financial impact of the industry. We then color-coded each state to indicate the number of jobs at stake. The result is an interesting snapshot of an industry at odds with the political divide.

Let’s start by taking a look at the places where the gun industry is comparably small. Hawaii ($39M), Delaware ($40M), Rhode Island ($97M), Vermont ($0.1B)—these places only have a few hundred people making and selling firearms. It may not be surprising that the Northeast lacks a robust gun industry, but also consider places like New Mexico ($0.13B), Nevada ($0.4B) or Oklahoma ($0.51B). The gun industry just isn’t a large employer in these states, despite the fact that they have some of the lightest regulations in the country.

At the other end of the spectrum, Texas has the largest gun industry measured both in terms of economic activity ($3.83B) and jobs (23,070). That’s not surprising. But several states in the Northeast and across the Midwest have robust multi-billion-dollar gun industries as well, including many liberal places with strict gun control legislation. California ($3.64B), Minnesota ($2.43B) and Illinois ($2.18B) are not exactly known for politicians friendly with the NRA. For example, Massachusetts just had its assault weapons ban upheld. The gun industry generates $1.86B in economic activity and provides some 7,116 people with jobs in Massachusetts, the same state where Clinton beat Trump by 29 points.

Top Ten States with the Highest Economic Impact of the Gun Industry

1. Texas: $3.83B and 23,070 jobs

2. California: $3.64B and 20,610 jobs

3. Minnesota: $2.43B and 11,650 jobs

4. Florida: $2.39B and 14,850 jobs

5. Illinois: $2.18B and 10,681 jobs

6. North Carolina: $1.98B and 11,427 jobs

7. Pennsylvania: $1.94B and 12,436 jobs

8. Massachusetts: $1.86B and 7,116 jobs

9. New York: $1.84B and 8020 jobs

10.   Ohio: $1.61B and 11,772 jobs

Our map indicates that the gun industry challenges the usual political divides. Texas has the largest firearms sector, but California is a very close second. This suggests that Republicans might think about a counterintuitive approach next time they campaign on the Second Amendment. If you want to promote gun-friendly legislation, just highlight the industry’s contributions to the economy.

Data: Table 1.1

Mapping the Economic Destruction of Climate Change in Every State

$
0
0

Climate change is a hot-button issue. Liberal news outlets worry about the planet becoming uninhabitable for humans, but conservative stations highlight any debate whatsoever in the scientific community as proof that things might not be so bad. For the sake of argument, let’s assume climate change is real. How might it affect the economy in the state where you live?

We found our data for how climate change would impact state GDP levels from a study published in the journal Science, which proposed a new model for calculating the economic impact of climate change. Researchers considered a range of different factors, like expected changes in agricultural yields, different demands for electrical use, changes in mortality rates, changes to the labor supply, damage due to a rise in sea levels and storm surges, and changes in crime rates. Basically, it’s an incredibly detailed and sophisticated model. We summarized the GDP data for each state to create a new color-coded map, revealing extreme disparities in how researchers anticipate climate change will affect different states.

The states poised to suffer the most damage due to climate change tend to have large cities located on the coasts. Florida and Texas both readily come to mind and in fact they top the list at more than $100B each in predicted losses due to impacts of climate change. Hurricanes and storm surges have already devastated multiple large cities in both states over the past several years. Houston is still rebuilding from the most recent flood and Tampa Bay barely dodged what could have been absolute devastation last fall during Hurricane Irma. California comes in a distant third place at $59.6B, followed by New York at $54.7B and Georgia at $34.2B.

Top 10 States with the Most Economic Damage From Climate Change

1. Florida: -$100.9B

2. Texas: -$100.7B

3. California: -$59.6B

4. New York: -$54.7B

5. Georgia: -$34.2B

6. Louisiana: -$21.8B

7. North Carolina: -$20.2B

8. Tennessee: -$19.8B

9. Pennsylvania: -$18.0B

10. Arizona: -$17.4B

The map demonstrates a clear pattern: states on the coasts, especially in the South and Southeast, stand to lose the most as a result of climate change. Nevertheless, looking at the middle of the country,many non-coastal states will also suffer billions of dollars in damage due to climate change. It is easier to think about how warmer ocean temperatures can increase the power of hurricanes, but it can be much more difficult to understand how drought and wildfires are directly connected to climate change. Even though these midwestern states won’t have to contend with rising sea levels, they will still experience significant costs related to climate change. A couple of the states we mentioned above, for example, experience tornadoes every year and, as rising ocean temperatures will almost certainly increase their frequency and intensity, it makes sense that they will have a greater probability of hitting a major urban center. The common myth persists but it is simply not true that tornadoes “can’t” hit big cities.

All that being said, on a macro level states in the middle and western interior of the U.S. stand to lose relatively little compared to coastal areas. The major exceptions to this rule are Rhode Island ($0.2B), Vermont ($0.5B), New Hampshire ($0.6B) and Massachusetts ($0.7B). The fact that Massachusetts will be relatively unaffected is particularly remarkable, considering that Boston is located on a major harbor. Wisconsin ($0.3B) stands out as the third least impacted, thanks in large part to the Great Lakes (where there’s a near infinite amount of freshwater). The lucky residents of Wyoming and Rhode Island will be glad to know that they can be the least-concerned about climate change from an economic perspective—it bears mentioning, of course, that these are also the least-populated and physically smallest states in the country, respectively.

There is one key assumption that has to be addressed before closing our analysis, however. Long-term predictions about GDP necessarily include several leaps of faith. For example, that productivity growth will continue at its current rate and that breakthrough technologies won’t dramatically change the economy. Suppose it was 1918 instead of 2018; imagine trying to predict the macroeconomic effect of climate change by the end of the century! The country went through a second World War, tons of families bought cars, moved to the suburbs, got air conditioning, Rock & Roll, the Internet—in short, the entire economy went through several enormous transformations during the past century. Do you think the economy will adapt to climate change, or will it just shrink to the challenge?

All that being said, California experienced literally the largest wildfires ever recorded in the state in the months after this data became public. Was that just a coincidence?

Data: Table 1.1

This Map will Show You the Best (and Worst) Cities to Make a Living

$
0
0

What is the most important measure for your family when it comes to financial security? Is it the poverty rate in your community? The overall unemployment rate? Or is it the total take-home pay coming into your pocket each year? We suspect it’s the latter, so we created a new map showing the places with the 10 highest and 10 lowest median annual earnings in the country.

We analyzed occupational employment statistics from the Bureau of Labor Statistics for 381 metro areas. Figures represent the median annual income as of May 2017, the most recent information available. We took the 10 cities with the highest incomes and the 10 with the lowest and mapped them as green and red spikes, respectively. We then labeled the top 10 in each category.

Top 10 Cities with the Highest Annual Median Wages

1. San Francisco-Redwood City-South San Francisco, CA: $77,360

2. San Jose-Sunnyvale-Santa Clara, CA: $77,180

3. California-Lexington Park, MD: $70,860

4. Washington-Arlington-Alexandria, DC-VA-MD-WV: $70,170

5. San Francisco-Oakland-Hayward, CA: $69,700

6. Washington-Arlington-Alexandria, DC-VA-MD-WV: $69,210

7. Boston-Cambridge-Newton, MA: $69,170

8. Bridgeport-Stamford-Norwalk, CT: $67,540

9. Framingham, MA NECTA Division: $66,480

10. Seattle-Bellevue-Everett, WA: $65,350

Top 10 Cities With The Lowest Annual Median Wages

1. Gadsden, AL: $35,190

2. Brownsville-Harlingen, TX: $35,240

3. Sebring, FL: $35,870

4. Myrtle Beach-Conway-North Myrtle Beach, SC-NC: $35,890

5. Hot Springs, AR: $36,040

6. Daphne-Fairhope-Foley, AL: $36,110

7. Jacksonville, NC: $36,310

8. McAllen-Edinburg-Mission, TX: $36,380

9. Morristown, TN: $36,570

10. Valdosta, GA: $36,880

The most obvious trend from our map is that cities with the lowest paying jobs tend to be in the Southeast, whereas most of the cities with the highest paying jobs are either on the West Coast or in the Northeast. You might expect places like San Francisco and San Jose to top the list, given the presence of so many high paying jobs with the tech community. The same can be said for Seattle and Boston. Interestingly, Washington, DC makes the top 10 as well, perhaps suggesting that there’s money to be had if you’ve got connections to those in power.

But we think the best place to live is probably San Francisco. It has an unemployment rate of just 2.8% (the lowest of any in the top 10) and a poverty rate of just 9.2% (the second lowest in the top 10). That signals an economy running at top speed. Great weather, by the ocean, plenty of good paying jobs—now if only they can do something about the earthquakes.

Seattle, Boston, San Francisco—you’ve no doubt heard of many of the cities with the highest paying jobs. Gadsen, Brownsville, Sebring—do any of those places ring a bell? Many of the metro areas with the lowest paying jobs are hard to find on a map precisely because they aren’t known for any booming industries. As a matter of fact, Texas has two cities in the bottom 10, neither of which are the big ones you’ve already heard of like Dallas or Houston.

There are a couple of interesting surprises on our map at both ends of the spectrum, however. Fairbanks, Alaska makes it into the top 10 (with a median salary of $56,760), thanks in large part to the scarcity of labor on the last frontier and the oil industry. Alaska produces so much oil that instead of taxing people’s income, the state government actually pays people to live and work there. Boulder, CO also stands out as the only city on Mountain Time making it into the top 25.

Inequality is one of the defining themes of the U.S. today, but it can be a hard thing to illustrate. Our map shows where the haves and the have-nots tend to live and, although it is not a complete picture, it demonstrates enormous regional differences in take-home pay for American workers.

Data: Table 1.1

This Map Shows Every State's Biggest Export

$
0
0

Is the United States sparking a trade war with the rest of the world or not? We aren’t quite sure what President Trump is thinking, but his recent comments on trade did get us thinking about what impact some of his proposals might have on different industries. So we created a new map demonstrating which industries export the most products in each state across the country.

We created out latest map in three steps. First, we used US Census Bureau data to identify the most prevalent export industries in 2017 in each state. Then we assigned a color for each category or industry, generating a snapshot of the geography of exports. Finally, for each state, we labeled the specific sector within the category, so that a state that is light blue for “Machinery/Transportation” is labeled specifically “Airplanes,” “Trucks,” etc. on the map. This lets you quickly and easily see which states (and regions) depend on which export industries for economic stability and growth.

We should also note that Washington, D.C. stands out for its ammunition productions ($336M). That's more than half as big as the airplane industry in next door Maryland ($521).

Top Ten States Most Dependent on Exports ($M)

1.     Washington (Airplanes): $41,848M

2.     Texas (Petroleum oil): $23,365M

3.     Louisiana (Petroleum oil): $13,441M

4.     New York (Diamonds): $12,173M

5.     Kentucky (Airplanes): $11,649M

6.     California (Airplanes): $7,142M

7.     Florida (Airplanes): $6,317M

8.     Nevada (Gold): $6,285M

9.     South Carolina (Airplanes): $6,275M

10.    Georgia (Airplanes): $5,844M

We can summarize the ten most export-dependent states by looking at only three industries: airplane manufacturing, natural resources, and precious metals/stones. As you might expect, states heavily dependent on natural resources are typically grouped together. There are three main petroleum-rich states across the South: Texas, Louisiana, and Mississippi. A group of coal mining states can be found in the North East, including Virginia, West Virginia, and Pennsylvania, and there’s gold to be found in western neighbors New Mexico and Nevada.

What may be more surprising is that manufacturing states tend to be grouped together, too. The Southeast is home to several states which are heavily dependent on sending airplanes to overseas buyers. That being said, airplane manufacturing is stretched across the country, with states from Kansas ($2,565M) to California ($7,142) illustrating that the supply chain for building airplanes clearly stretches far and wide.

And that leads us to the state at the very top of the list: Washington is the most heavily dependent on exports by far, almost doubling second-place Texas. That’s thanks almost entirely to the presence of Boeing. The company sells both commercial jetliners and aerospace technology (think rockets) to other civilian companies and governments around the world. This explains why the media covers the potential impact to Boeing for every nuance of trade war rhetoric emanating from the White House.

So what is the biggest takeaway from our map? Building and manufacturing airplanes for the global market is deeply important in 17 states, totaling just under $100 billion in exports, and that’s not even the entire value of national airplane exports—that’s just for those states in which it is the leading export. The threat to President Trump’s pro-tariff agenda is that other countries may retaliate with their own protectionist measures, ultimately hurting companies like Boeing. If that happens, the economic damage will ripple across the country, in the airplane manufacturing industry as well as in the many other export industries that are key pieces of different states’ economies.

Data: Table 1.1


These States Have the Highest Auto Insurance Premium Increases After a Claim

$
0
0

Auto insurance companies portray themselves as friendly and forgiving in television commercials, but they are less friendly than you might think. After filing just one claim, car insurance premiums increase by an average of 41.81%, according to an annual study by insuranceQuotes and Quadrant Information Services. Just how much insurance rates are increased depends on the state where you live. See how your home state compares to others in the chart below.

To create our graphic, each state was given its own line graph, with additional lines for D.C. and the national average. The first point represents the average annual premium for each state, the second point represents the average annual premium after one claim, and the gap between the two points shows the average increase after making one claim. We also color-coded each line to show the significance of the increase in terms of the dollar amount being paid by the drivers in each state. The data we used came from insuranceQuotes and the National Association of Insurance Commissioners (NAIC). To generate their averages, insuranceQuotes looked at the impact of one new claim of $2,000 or more on a married, 45-year old woman with a job, an excellent credit score, no lapses in coverage, and no previous auto insurance claims.

States with Highest Rate Increase After one Claim

1. New Hampshire: 65.9%

2. California: 63.2%

3. Rhode Island: 61.7%

4. Massachusetts: 60.9%

5. Iowa: 56.5%

States with Lowest Rate Increase After one Claim

1. Kentucky: 19.4%

2. Tennessee: 20.1%

3. Michigan: 22.2%

4. Oklahoma: 23.4%

5. West Virginia: 27.8%

New Hampshire is in a league of its own. Although the state’s average annual premium of $733 is below the national average of $841, it more than makes up for it with a 65.9% rate increase after filing one claim, the highest percentage increase in the nation. After the rate hike, premiums in New Hampshire average $1,216.

For overall premium cost, however, Rhode Island has New Hampshire beat. After just one claim, America’s smallest state has the seventh-highest average premium at $1,066 thanks to the third-highest percentage rate increase of 61.7%. That means drivers in Rhode Island will pay an additional $657 per year on car insurance after one claim, the highest increase in the country dollar-for-dollar.

When looking at our chart, an interesting pattern emerges—all of the largest increases in premiums occur in states that start out with higher premiums, even without any claims having been filed. In most of the states where the premiums start out below the national average, their average rate increases are also lower. Unfortunately for drivers in states like Texas (53% increase after a claim) and Connecticut (43.8%), their premiums start out high and only get worse. Other places, however, start out so low that, even though they have a big jump after a claim, their premium still isn’t too bad compared to some of their neighbors.  In Iowa, for example, our hypothetical driver starts out with a premium of $572. After a claim her rate is increased by a whopping 56.5%, but she’s still only paying $895 every year.

The pattern seen with Iowa is particularly exemplified by four other states. Even after making one claim the happy residents of Wyoming ($826), South Dakota ($834), Indiana ($797), and Idaho ($734) are still paying premiums below the national pre-claim average of $841.

Auto insurance rates vary throughout the country, as do insurance premium increases after filing one claim. But in some states, like Iowa, filing one auto claim won’t increase your insurance premiums by too much because of the state’s already low average insurance costs. Nobody plans to get into an accident and file a claim, but when in one of the more expensive states, make sure to drive extra carefully!

Data: Table 1.1

Mapped: What Each State Needs the Most from International Trade

$
0
0

President Trump’s trade war rhetoric is causing a fair amount of economic uncertainty right now. Is he planning to implement tariffs on imported goods from other countries or not? And what about other countries planning their own tariffs on American-made goods? All this back-and-forth debate got us thinking about which industries import the most goods in every state. Please note that all USD estimated value is based on average market value 2017.

The U.S. Census Bureau tracks all sorts of things, including imports and exports moving into and out of each state. Our numbers represent the total value ($M) of goods with a final destination in that state last year. For example, Missouri imported $853M in aluminum in 2017, the highest figure for any sector in the state. All of that aluminum no doubt originated in a wide variety of other countries. We color-coded each industry by its broader category, creating a snapshot of imports on a state-by-state basis.

Top Ten States with the Greatest Amount of Imports ($M)

1. California (Cars): $36,517M

2. Texas (Crude oil): $34,559M

3. New York (Diamonds): $20,296M

4. Illinois (Crude oil): $19,917M

5. Michigan (Cars): $18,404M

6. Louisiana (Crude oil): $15,949M

7. Tennessee (Meds): $9,332M

8. Pennsylvania (Crude oil): $9,189M

9. Georgia (Cars): $9,1467M

10. Maryland (Cars): $8,368M

There is one particularly obvious industry on our map: nobody sitting in L.A. traffic would be surprised that California imports a lot of cars ($36,516M). For the most part, though, there are a handful of surprising clusters around the country, including a group of Midwestern states shaded in orange that are importing millions in medicine. Engine parts dominate the import sectors in North Carolina and South Carolina. All but one state touching the Gulf Coast has its top import from crude oil.

Perhaps the most surprising fact is that so many states import the same type of goods that they export. For example, Texas simultaneously imports $34,559M in crude oil and exports $23,365M in petroleum oil each year. And it’s not just oil—the same can be said about other industries as well. Tennessee imports $9,332M of medicine each year and exports medical appliances at about $2,320M. Diamonds top the charts in both imports and exports for New York. Computer parts and electronics move in and out of New Mexico more than any other industry.

There are a couple of possible explanations for this phenomenon. First off, things like crude oil are always priced and sold on the global market. That means a Texas oilman can sell his product to a global distributor in Houston, then get his truck’s oil changed with stuff that actually originated in Saudi Arabia. Second, and more importantly, the U.S. Census Bureau calculates imports as the “final” place something is purchased, but that’s not necessarily where it is consumed or used. For example, a company in Texas might buy crude oil from abroad, then process it in one of its 30 refineries, and then sell it to another company which ships it to a different state where it is actually used. The crude oil still counts as an import for Texas but it would take a whole separate article to track where the resulting petroleum products are actually consumed.

Our map represents a quick view of over $263M in top-ranked imports to states around the country. That’s a big slice of the import market, but remember that the total market for imports of goods and services is around $2.7 trillion! President Trump’s trade war rhetoric is therefore potentially more harmful to a much broader swath of the American economy than what our map can capture. That being said, these are some of the industries most at risk if other countries institute counter-tariffs on American goods.

Data: Table 1.1

The Best Schools for Under $20k in One Map

$
0
0

Here’s a fact: more than 70% of college graduates carry student loan debt, and the average debt burden stands at $37,172. A surprising new study reveals that the problem affects millennials just as much as baby boomers. These figures got us thinking about the best schools that won’t break the bank, so we compiled a new map of the top universities in every state costing less than $20,000 in annual tuition and fees.

We compiled the data from U.S. News & World Report’s annual Best College Rankings. We captured the top-ranked college in every state costing less than $20k each year in tuition and fees (excluding room and board). We then color-coded each state in a heat map to represent the relative cost of the best higher education—light blue states are cheaper than dark blue states. We added the school’s logo for quick reference. This snapshot lets you quickly and easily see where getting a degree at a reputable institution costs the least.

Top Ten States with the Cheapest Flagship Universities

1. Wyoming - University of Wyoming: $5,218

2. Utah - Brigham Young University, Provo: $5,460

3. Florida - University of Florida: $6,380

4. New Mexico - University of New Mexico: $7,146

5. Montana - Montana State University: $7,150

6. Idaho - University of Idaho: $7,488

7. Alaska - University of Alaska, Fairbanks: $7,520

8. Nevada - University of Nevada, Reno: $7,599

9. Mississippi - University of Mississippi: $8,290

10. North Dakota - University of North Dakota: $8,447

There are a couple of caveats to keep in mind. Many public universities charge different rates for students who already live in that particular state and students who live in another state. For example, the University of Iowa will only charge Iowa residents $9,190, but the school will charge nonresidents $30,834, or more than three times as much. It’s worth noting, however, that some universities have reciprocal agreements with other states, where they agree to charge the resident tuition rates for nonresidents, like the agreement between Wisconsin and Minnesota. In other words, don’t automatically assume you can or cannot pay the tuition rates listed on the map. It always pays to check.

In fact, most people don’t even pay the published tuition rates. Fully two-thirds of college kids receive some sort of financial aid in the form of scholarships or grants. That means that if you can combine a scholarship with a low tuition bill from one of these schools, you will be in the best possible position to escape student loan debt altogether.

All that being said, there are several key insights on our map. From a geographical perspective, there are affordable top-ranked programs in every region of the country. The West tends to have a higher number of inexpensive universities, like the University of New Mexico ($7,146) or Montana State University ($7,150), but similar price points can be found out East, too. Affordable education is available especially in places like Florida, West Virginia, and Maine. Even in New York, Binghamton University costs just under 10 grand.

What’s the main takeaway from our map? The least expensive top-ranked school is the University of Wyoming, where it only costs $5,218 each year in tuition and fees. Looking across the entire country, though, there are 28 states with schools under $11,000 and 46 under $16,000. All this goes to show that getting a degree is always a serious investment, but you don’t necessarily have to take on a mountain of debt to graduate.

Data: Table 1.1

Do You Make Enough to Afford a Two-Bedroom Home?

$
0
0

Affordable housing is already a hot button political issue. Housing advocates have long pointed out the lack of affordable options in big cities with booming tech sectors, like San Francisco, but where does that leave the rest of the country? We wanted to find out, so we created a new map that illustrates how much an average worker would need to earn to afford a typical two-bedroom apartment in each state.

We found the data for our map through the National Low Income Housing Coalition (NLIHC), an organization focused on creating public policies that help poor Americans afford decent homes. The organization analyzed the combination of an average worker’s wage and the cost of housing to determine which states have the worst housing problems, keeping in mind that people should not spend more than 30% of their income on housing. We developed an intuitive, color-coded map highlighting how much money you need to earn to afford a two-bedroom home, revealing the places with the biggest problems in housing affordability.

The first and most obvious conclusion from our map is that every single state requires more than the federal minimum wage to afford a typical two-bedroom. Even at the very bottom of the spectrum, in Puerto Rico, you would need to make $9.68 per hour. At the opposite end, someone in Hawaii would need to bring home an incredible $35.20. The vast majority of states fall somewhere in the middle of these two extremes, typically between $14 to $18 per hour. The federal minimum wage is $7.25 per hour, which means that even if you have a working spouse, DINC workers (dual income, no children) making minimum wage still cannot afford a two-bedroom in most of the country.

Another interesting takeaway from the map has to do with geography. There’s a clear cluster of pink and red (more expensive) states in the Northeast, stretching as far south as Virginia. This indicates that workers need to make around 3 times the federal minimum wage to cover their rent. Bear in mind that not every low-wage worker makes the federal minimum; in fact, many states and cities set their own, higher, wage floors. In New York City, for example, the minimum wage is progressively rising every year until it tops out at $15 by 2021. Even by this measure, employees working in these low-paying jobs will still fall hopelessly short of earning a sustainable, livable wage—you need to make $28.08/hr today to afford a two-bedroom in the state of New York (it should go without saying that the state average is certainly much lower than that of housing in the City), let alone what you will need to earn three years from now.

Top 10 States with the Highest Hourly Wage Needed to Rent a 2 Bedroom Home 

1. Hawaii: $35.20 per hour

2. Washington, DC: $33.58 per hour 

3. California: $30.92 per hour

4. Maryland: $28.27 per hour

5. New York: $28.08 per hour

6. Massachusetts: $27.39 per hour 

7. New Jersey: $27.31 per hour

8. Connecticut: $24.72 per hour

9. Alaska: $24.16 per hour

10. Washington: $23.64 per hour

The current debate surrounding affordable housing clearly focuses too much on big cities with housing shortages. These places are experiencing rapid growth from booming technology sectors, and they don’t represent the broad experiences most Americans face every day. Politicians would be wise to pay a lot more attention to how the working poor struggle to make ends meet everywhere in the country.

Data: Table 1.1

Mapping the Hidden Burden of Local and State Sales Taxes

$
0
0

Tax policy experts usually think about sales tax in one of two ways. On the one hand, it is a regressive tax because it takes a greater percentage of income from poor and middle-class people than the wealthy. But on the other hand, sales tax proponents like to point out it’s a tax on consumption, and the amounts people pay depends on how much stuff they buy. The situation is made even more complicated by the fact that local municipalities and county governments often pass their own sales tax measures. This made us wonder if there was a way to visualize the current sales tax situation across the entire country.

We found our numbers from the Tax Foundation, a public policy organization advocating for a simplified tax code. They gathered statewide sales tax data and combined it with a calculation for the average local sales tax rate, weighting city and county rates by population. We represented each state’s sales tax burden by creating a circle—the larger the circle, the greater the burden. We then split the circle in two to visualize which portion comes from statewide mandates verses local ordinances. This approach creates an apples-to-apples comparison for sales tax levies across the country.

Top 10 States with the Heaviest Total Sales Tax Burden

1. Louisiana: 10.02%

2. Tennessee: 9.46%

3. Arkansas: 9.41%

4. Washington: 9.18%

5. Alabama: 9.1%

6. Oklahoma: 8.91%

7. Illinois: 8.7%

8. Kansas: 8.68%

9. California: 8.54%

10. New York: 8.49%

You might notice that there are a few states missing from our visualization: Oregon, New Hampshire, Montana and Delaware. That’s because none of these places have any sales taxes at either the state or local levels. Alaska deserves special mention because although it does not have a statewide sales tax, there is an average 1.76% local tax rate. And the lowest statewide rate (other than 0%) belongs to Colorado at 2.9%, followed by a number of states at 4% including Hawaii, Wyoming, Georgia, New York and Alabama.

Analyzing the entire sales tax burden complicates our political narrative that conservative places tend to tax people less. Our map contains large circles for states across the South, led most notably by Louisiana with an incredible combined sales tax rate of over 10%. Many of these places have relatively low statewide levels, like Alabama (4%) or Oklahoma (4.5%). Tennessee is exceptional thanks to its statewide rate of 7%, but keep in mind they don’t tax earned income whatsoever.

The opposite is also true for more liberal states like Illinois, California and Washington. These places have comparatively onerous statewide tax burdens, led by California at 7.25%. But on the flip side, cities and counties maintain very low local sales taxes. One exception is New York, where a local ordinance of 4.49% from New York City pushes the Garden State to 8.49% overall.

So where is the best place to live where you can keep most of your money? Should you just move to a state with no sales tax whatsoever? Remember that there are two sides to the taxation question—the government can tax money as you earn it and as you spend it. And looking at simple statewide sales tax rates doesn’t paint a full picture either. It is only by considering the combination of statewide and local tax rates that you can see the true sales tax burden.

Data: Table 1.1 

Viewing all 687 articles
Browse latest View live