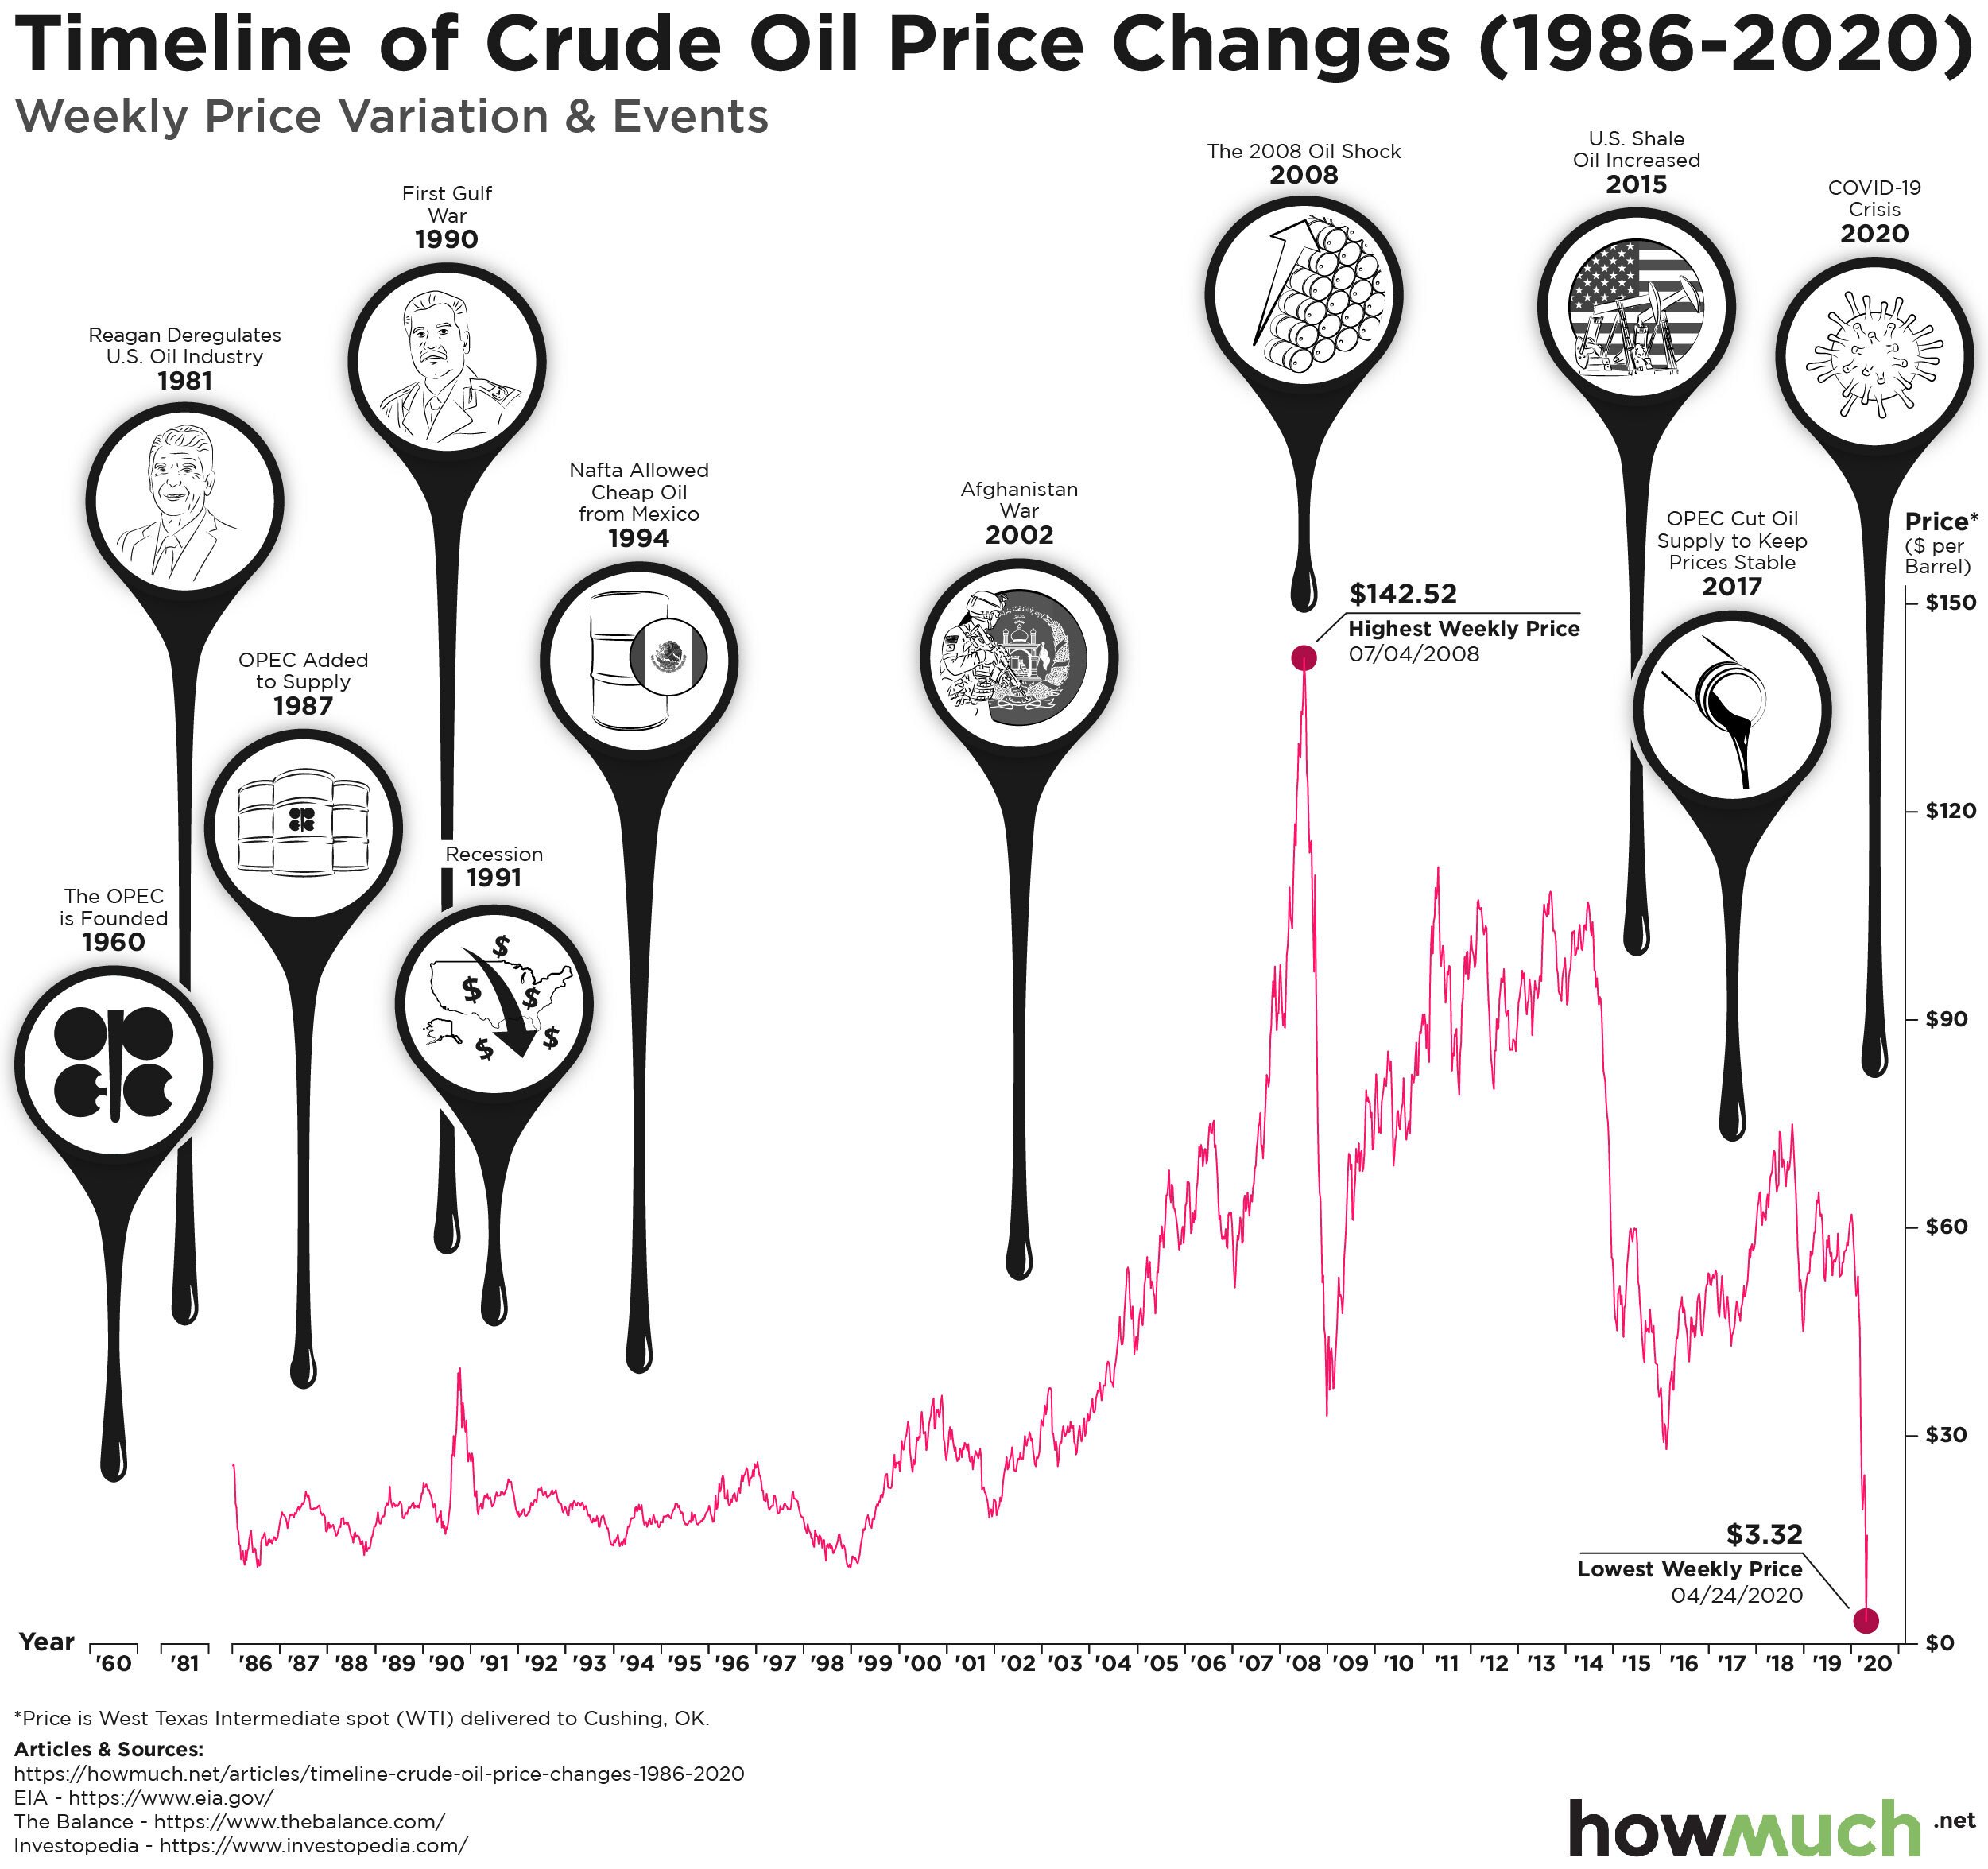
Last month, oil contracts turned negative for the first time in history amid the coronavirus lockdown. While consumers may be taking advantage of paying less than $1 per gallon of gasoline, producers are wary of a coming oil glut.

- The price of oil fell by 83.5% in late April 2020, the largest single-week drop-off since records began in 1986.
- Oil contracts fell below zero for the first time in history.
- Global daily oil consumption fell from 100 million barrels to between 65 and 70 million.
- OPEC began cutting product by nearly 10 million barrels per day in early May.
Our data comes from the United States Energy Information Administration. The viz is a line chart showing the history of West Texas Intermediate crude oil prices since 1986. This is the spot price of oil as delivered to Cushing, Oklahoma. We also include events influential to oil prices, as gathered from Investopedia and The Balance.
Top Five Biggest Weekly Increases in Crude Oil Prices
- May 1, 2020: +373.19%
- Jan 2, 2009: +28.56%
- Aug 8, 1986: +27.77%
- Aug 10, 1990: +24.29%
- Jun 26, 1998: +17.69%
Top Five Biggest Weekly Decreases in Crude Oil Prices
- Apr 24, 2020: -83.50%
- Mar 13, 2020: -28.92%
- Mar 20, 2020: -25.32%
- Mar 27, 2020: -19.64%
- Apr 17, 2020: -17.57%
Oil prices had been relatively low in the weeks leading up to the coronavirus, in part due to the United States becoming a net exporter for the first time in decades. Even so, the commodity suffered its single-biggest weekly drop in April 2020, at -83.5%, due to the coronavirus crisis.
Prior to the virus putting much of the economy on standby, the world was consuming around 100 million barrels a day. By late April, however, demand had dropped by around a third, to between 65 and 70 million. Including the March price rout, oil prices are now down 57% this year. Ordinarily, low oil prices lead to greater consumer spending. But with nearly 95% of the U.S. population on lockdown due to the coronavirus, consumers had no reason to purchase gasoline. And while oil is used for far more than gasoline, including products like asphalt and heating oil, nearly every sector of the economy came to a standstill, causing a historic drop in demand.
Indeed, oil powers nearly every sector of the economy, and arguably even politics too: price volatility is often accompanied by geopolitical instability. To learn about the major industry players, check out this HowMuch article on global oil reserves: you will see that a drop in oil price could significantly affect major world powers like the United States, Russia and Saudi Arabia.
Historically, some of the most volatile swings in oil prices have accompanied geopolitical instability, and vice versa, such as during the 1990 Iraqi invasion of Kuwait. Adjusting to the extreme drop in oil consumption, the Organizations of the Petroleum Exporting Countries (OPEC) began cutting its output by nearly 10 million barrels a day. However, this may not be enough to avoid a massive oil glut later this year.
Have oil producers cut production enough to cause a supply glut? Where do you see the price of oil heading? Let us know in the comments and share with your friends.
Data: Table 1.1