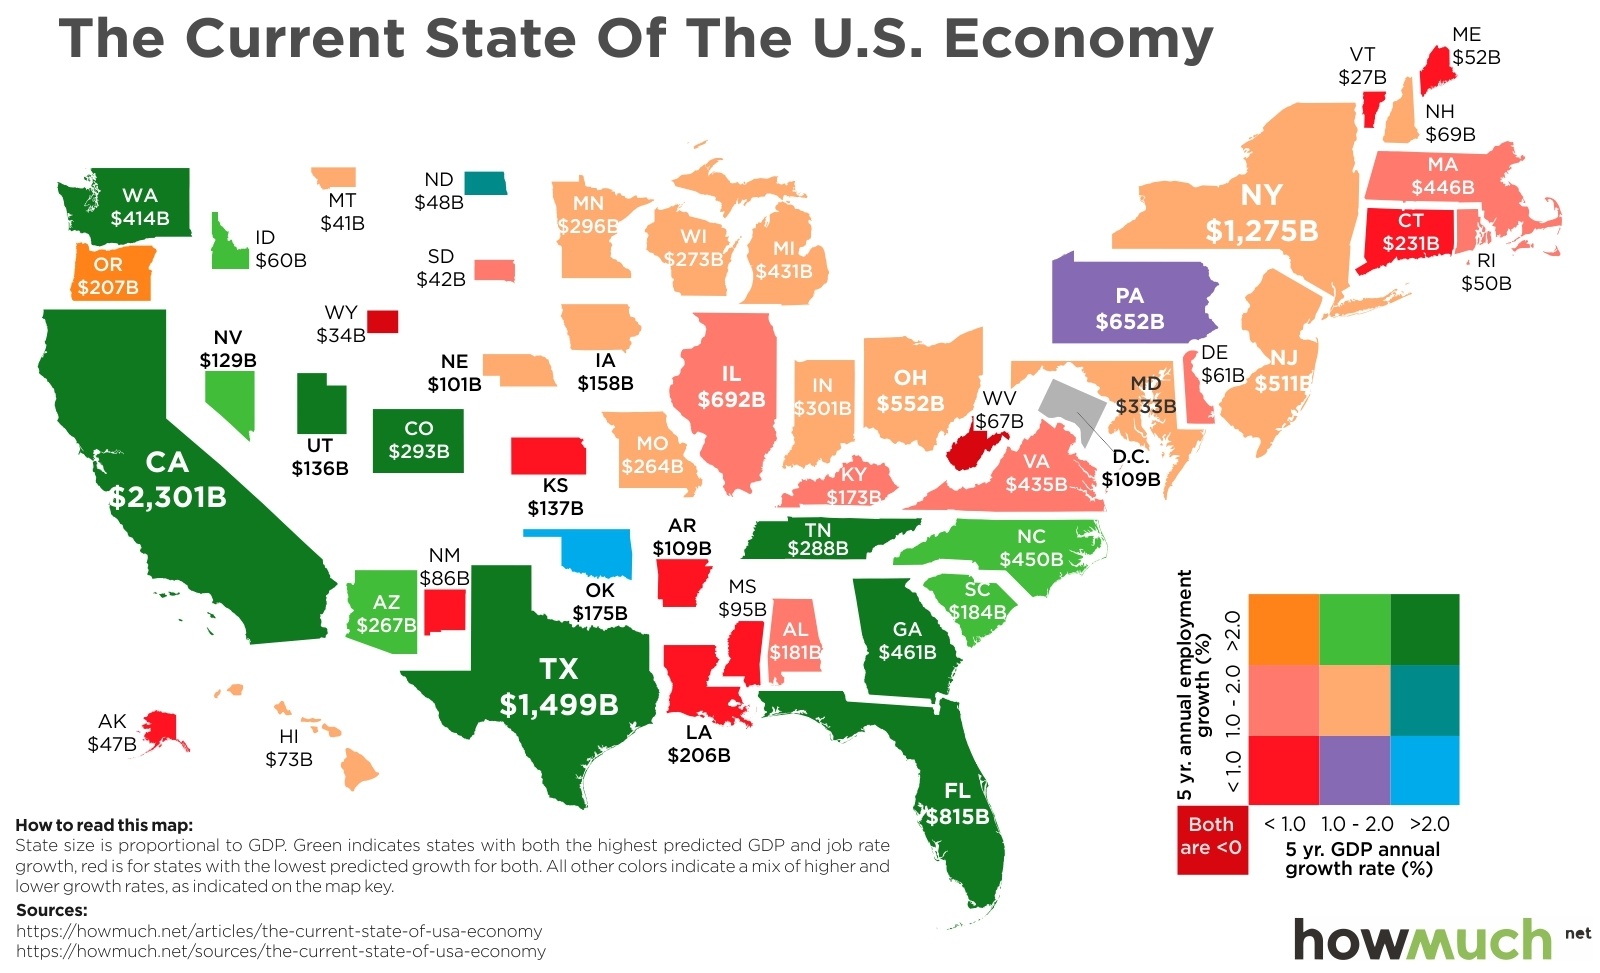
The U.S. economy has finally regained its pre-recession levels of employment and Gross Domestic Product (GDP). What does that mean? More people are getting hired, and they’re spending their paychecks. That’s all good, but it’s no secret the economy has undergone an uneven recovery since the Great Recession. So how does the recovery stack up in different parts of the country? Check out this new visualization. 
Five Best States (by GDP, GDP change, and employment change)
1. California ($2,301B GDP, 3.2% GDP change, 2.8% empl. change)
2. Texas ($1,499B GDP, 3.9% GDP change, 2.5% empl. change)
3. Florida ($815B GDP, 2.4% GDP change, 2.9% empl. change)
4. Georgia ($461B GDP, 2.2% GDP change, 2.4% empl. change)
5. North Carolina ($450B GDP, 1.5% GDP change, 2.1% empl. change)
Five Worst States (by GDP, GDP change, and employment change)
1. Wyoming ($34B GDP, -1.0% GDP change, -0.2% empl. change)
2. Alaska ($47B GDP, 0.8% GDP change, 1.1% empl. change)
3. West Virginia ($67B GDP, -0.1% GDP change, -0.5% empl. change)
4. Louisiana ($206B GDP, -0.3% GDP change, .06% empl. change)
5. New Mexico ($86B GDP, 0.6% GDP change, 0.7% empl. change)
Several things immediately stand out about this visualization. First off, all the landlocked states in the Western U.S. have very small economies. The band stretching from Montana to Arkansas suggests that this region has not seen significant economic growth in several years. The best states from an economic perspective are by and large located along the Gulf Coast and the West Coast. The only states entirely outside the Sun Belt to see more than 2% annual employment growth and 2% GDP growth are Washington and Idaho. In fact, no state north of the Mason-Dixon Line achieved a similar level of performance. It turns out people in the warmer states are enjoying a nice economic expansion in addition to their suntans.
Don’t get us wrong. The northeast is still responsible for significant economic output. When you combine New York, Pennsylvania and New Jersey together, they account for $2,438B in GDP alone. This is equivalent to the entire output of the 25 lowest states in the country. They still do it big in the Big Apple.
Our map shows how uneven the economic recovery over the last five years has been, and it hints at some of the large-scale changes going on in the U.S. The good news is that employment has grown in every state with only two exceptions (Wyoming and West Virginia). The odds of getting a job are better for almost everyone today than they were five years ago, especially if you live on the Gulf or West Coasts.
Source: Table 1.1