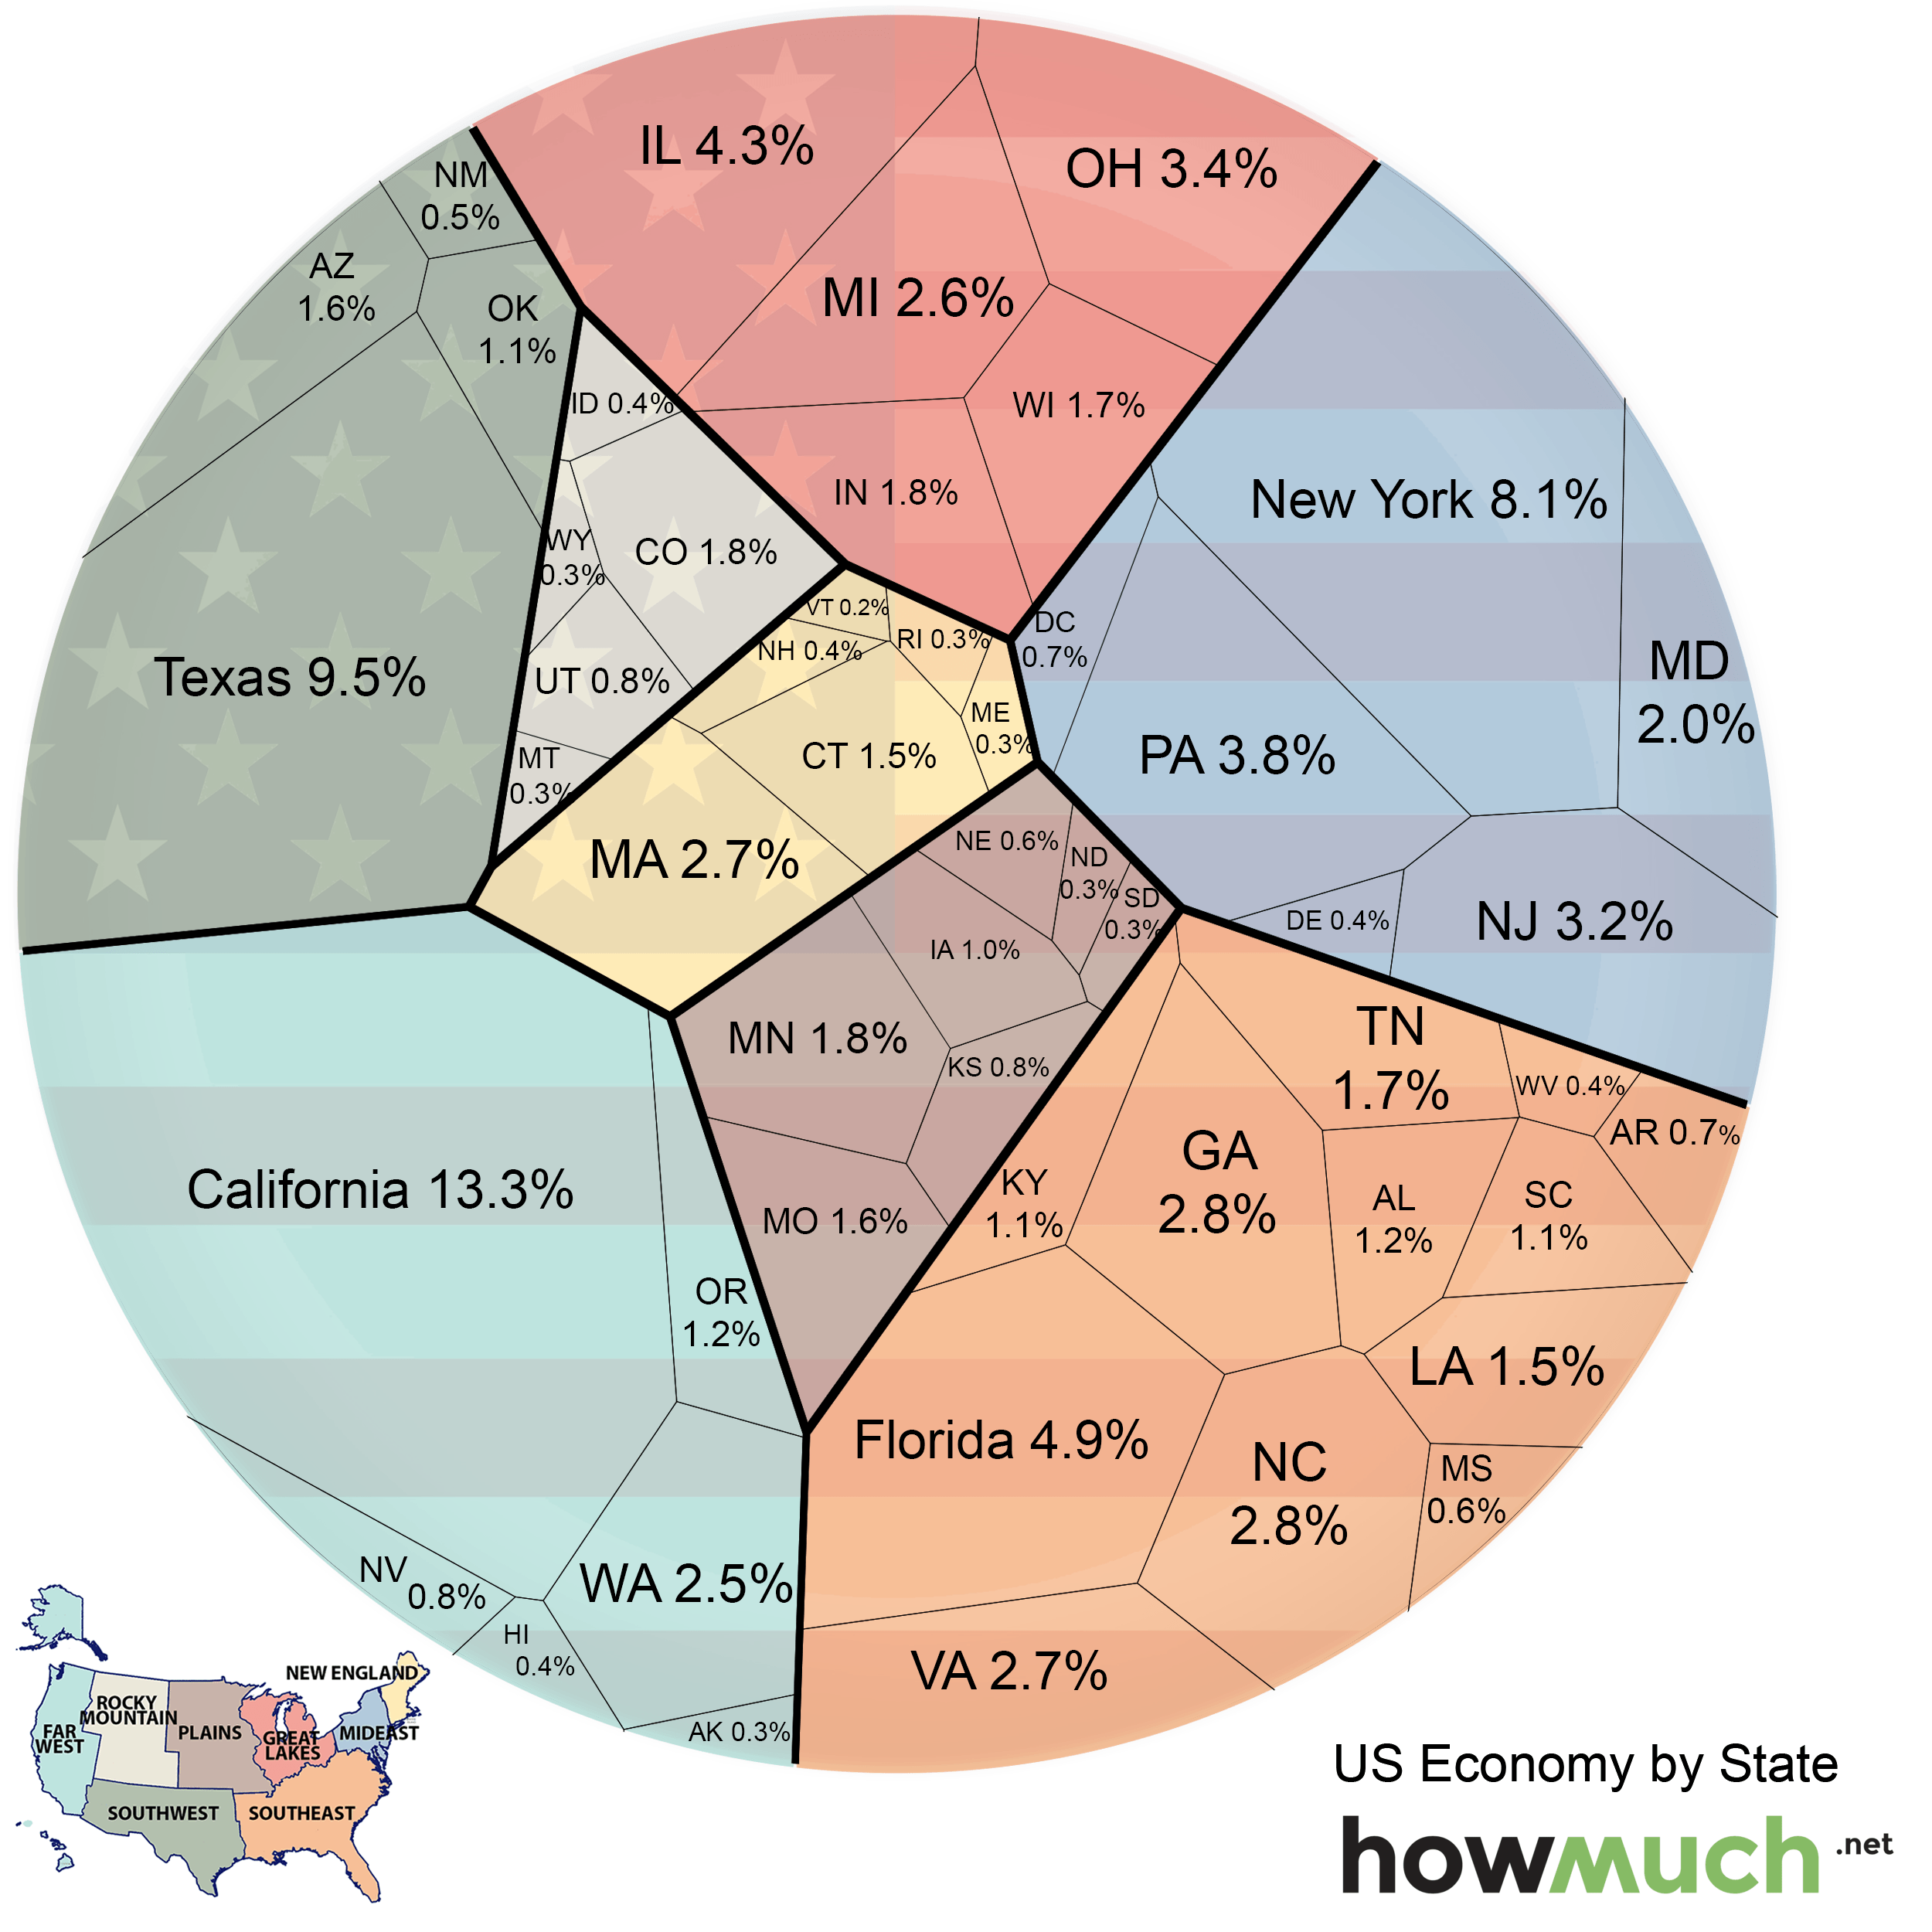
The US as a whole had a GDP of $17.3 trillion in 2014, making it the richest nation by a large margin (about $7 trillion ahead of China). But, as it is well known, the value of economic activity is unevenly distributed throughout the country. The diagram below shows the relative economic value (in 2014 dollars) of each US state. The states are also grouped by color according to the region that they comprise. The first thing you will notice is that most economic activity is concentrated in three regions: Far West (18.6%), Southeast (21.3%), and Mideast (18.2%). All of these regions contain major US States and cover the US coastline, which is where most large cities are located – so it is not surprising that most of the economic value in the US is generated in these regions.

In terms of states, California (13.3%), Texas (9.5%), and New York (8.1%) have by far the largest economies. The states with the smallest economies are Vermont (0.2%), Maine, Rhode Island, North and South Dakota, Montana, Wyoming, and Alaska (all representing about 0.3% of the US economy).
How has this relationship changed over time? All states have increased their economic outputs between 2011 and 2014, but some have grown faster than others. In terms of regional influence, the Southeast economy has shrunk in relation to other regions by just 0.4% over the last four years, while the Southwest economy has grown by 0.8% relative to other regions. Texas increased the size of its economy by almost $300 billion, more than any other state, growing from 8.8% of the US economy in 2011 to 9.5% in 2014. This growth in Texas was fueled by mining and manufacturing. California grew by just under $300 billion, but only increased its share of the total economy by 0.1%.
It seems as though the largest economies in the US are poised to stay that way for the foreseeable future thanks to healthy economic growth rates. The smaller states are growing in terms of economic output, but in most cases at slower rates.
If you have any thoughts on this subject, drop us a line! We would love your feedback.
Get the best of HowMuch delivered to your inbox weekly. You are going to love it!
Source: Bureau of Economic Analysis